


 Add Category
Regarding the CoreLogic property price data..
CBA senior economist Belinda Allen has circulated a note with some insightful graphs in it.
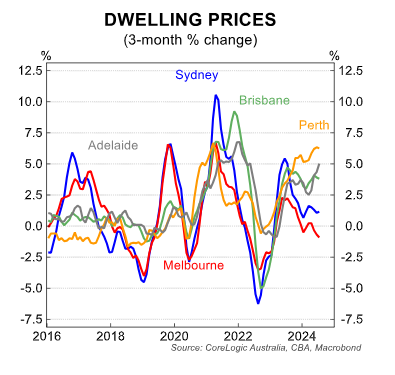
According to CoreLogic, home prices across Australia's eight capital cities rose by 0.5% in July, which was the same as in June, but there's divergence across those cities.
Three capital cities recorded price falls in July: Hobart (-0.5%), Melbourne (-0.4%) and Darwin (-0.2%). Ms Allen says Melbourne, in particular, is dealing with unique factors including land tax changes and the fact that building approvals have held up in Victoria.
The graph below shows the differential in dwelling price growth across our different cities right now:
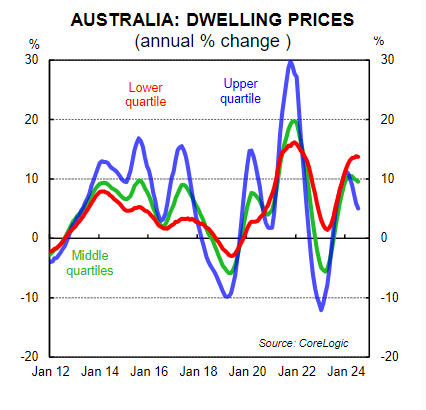
And take a lot at this next graph.
It shows the different rates of growth in dwelling prices for lower value home prices (lowest 25% in value), the middle quartiles (between 25% and 75%), and the upper quartile (most expensive 25%).
Ms Allen says lower value home prices are "significantly outperforming" the most expensive homes at the moment, with rates of annual growth well above 10%.
That's not something we've typically seen in the last 10 years, but it's easy to understand why it's happening right now.
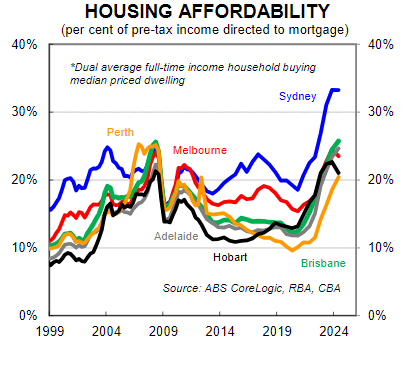
And then there's this graph.
It shows that, despite the recent slowdown in prices in Sydney, and falls in Melbourne and Hobart, the question of affordability is a different matter.
"Sydney remains well above other capital cities in terms of lack of affordability while Brisbane, Adelaide and Perth continue to deteriorate," Ms Allen says.
For anyone who can't read the smallprint in that graph, it's showing the per cent of pre-tax income that's directed towards a mortgage.